In this article we will discuss different ways of monitoring data solutions including different types of Azure SQL databases like Azure SQL DB, Azure SQL DW, Azure SQL Managed Instance. This can be done using 2 approaches:
- Single database monitoring using Internal SQL Server features (SQL Server Query Data Store, SQL Server Dynamic Management Views, SQL Server Extended Events), DTU consumption in Azure portal, Query Performance Insight, SQL Database Advisor;
- Multiple database monitoring and reacting using Azure Monitor with Azure SQL Analytics, Event Hubs, Logic Apps, and Power BI.
Monitoring and troubleshooting single database performance:
- DTU consumption in Azure portal
- Query Performance Insight
- SQL Database Advisor
- Azure SQL Intelligent Insights
- Real-time monitoring: dynamic management views (DMVs), extended events, and the Query Store.
Monitoring Multiple databases and reacting to events can be done using Azure Monitor with Azure SQL Analytics, Event Hubs, Logic Apps, and Power BI.
DTU consumption in Azure portal
DTU consumption in Azure portal: for each SQL database use Monitoring chart to look for resources approaching their maximum.
Query Performance Insight
Query Performance Insight lets you spend less time troubleshooting database performance by providing the following:
- Deeper insight into your databases resource (DTU) consumption
- The top CPU-consuming queries, which can potentially be tuned for improved performance
- The ability to drill down into the details of a query
SQL Database Advisor
SQL Database Advisor allows to view recommendations for creating and dropping indexes, parameterizing queries, and fixing schema issues. The advisor assesses performance by analyzing SQL database’s usage history. The recommendations that are best suited for running your database’s typical workload are recommended.
Azure SQL Intelligent Insights
Azure SQL Intelligent Insights can be used for automatic monitoring of database performance. Once a performance issue is detected (for example, performance degradation), a diagnostic log is generated with details and Root Cause Analysis (RCA) of the issue. Performance improvement recommendation is provided when possible.
Real-time monitoring
You also can use dynamic management views (DMVs), extended events, and the Query Store to get performance parameters in real time. See performance guidance to find techniques that you can use to improve performance of Azure SQL Database if you identify some issue using these reports or views.
SQL Server Query Data Store (QDS) allows to ask questions about workloads gathering a history of compilation and runtime metrics throughout query executions:
- Compile-time statistics: Query text; Semantic-affecting settings; Containing objects: SP, TVF, trigger; Parametrization type; Compilation, binding, and optimization stats; Query plan plus initial and last compile/execute times.
- Run-time stats (aggregated on an interval): Count of executions and first/last execution time; AVG, LAST, MIN, MAX, and STDEV for metrics Duration, CPU time, Logical I/O reads and writes, Physical I/O reads, DOP, Memory grants, Number of rows.
Dynamic Management Views (DMVs) – Microsoft Azure SQL Database enables a subset of dynamic management views to diagnose performance problems, which might be caused by blocked or long-running queries, resource bottlenecks, poor query plans, and so on. This topic provides information on how to detect common performance problems by using dynamic management views. SQL Database partially supports database-related, execution-related and transaction-related DMVs.
Extended Events (XE) allows to monitor and troubleshoot performance issues, SQL statement executions and full-text related errors. The results can be captured to Ring buffer target (briefly holds event data in memory), Event counter target (counts all events that occur during an extended events session), or Event file target (Writes complete buffers to an Azure Storage container).
Azure Monitor
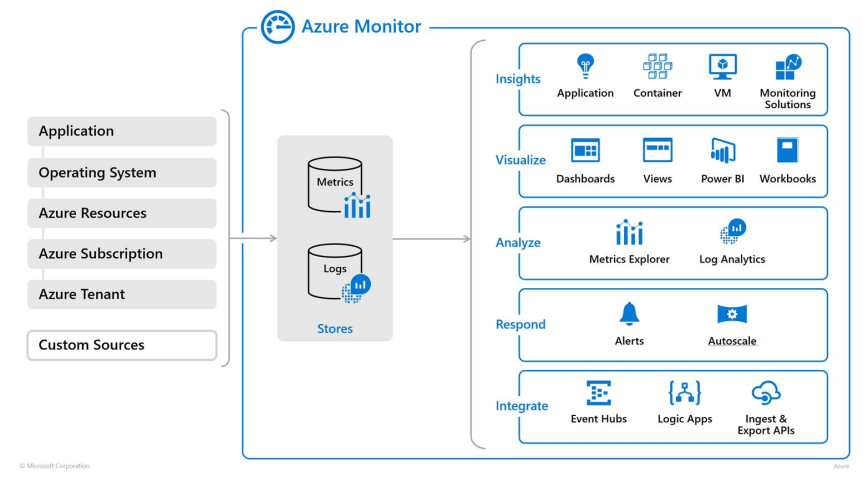
Azure Monitor maximizes the availability and performance of your applications by delivering a comprehensive solution for collecting, analyzing, and acting on telemetry from your cloud and on-premises environments. It helps you understand how your applications are performing and proactively identifies issues affecting them and the resources they depend on.
Azure Monitor uses two data stores (for metrics and for logs). It takes data from the sources that collect telemetry from different monitored resources and populate the data stores. Azure Monitor provides analysis, alerting, and streaming to external systems of the collected data.
Most important services related to SQL monitoring using Azure monitor are following:
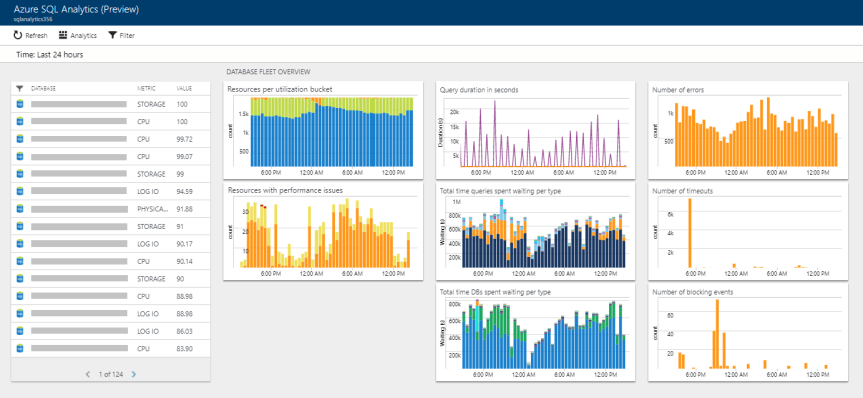
- Azure SQL Analytics – provides SQL-related dashboards
- Logic Apps – allows creating automated workflows reating to events in Azure Monitor
- Event Hubs – allows streaming of monitoring data to partner monitoring tools
- Power BI – allows to create and customize custom visualizations.
Azure SQL Analytics is a cloud monitoring solution for monitoring performance of Azure SQL databases, elastic pools, and Managed Instances at scale and across multiple subscriptions. It collects and visualizes important Azure SQL Database performance metrics with built-in intelligence for performance troubleshooting.
Logic Apps is a service that allows you to automate tasks and business processes using workflows that integrate with different systems and services. Activities are available that read and write metrics and logs in Azure Monitor, which allows you to build workflows integrating with a variety of other systems.
Azure Event Hubs is a streaming platform and event ingestion service that can transform and store data using any real-time analytics provider or batching/storage adapters. Use Event Hubs to stream log data from Azure Monitor to partner SIEM and monitoring tools.
Power BI is a business analytics service that provides interactive visualizations across a variety of data sources and is an effective means of making data available to others within and outside your organization. You can configure Power BI to automatically import log data from Azure Monitor to take advantage of these additional visualizations. Note. This is especially convenient when you also monitor SaaS solutions, for example Power BI reports usage with Power BI Premium Capacities – in this case you will have all dashboards and interactive reports in one collaboration environment.
Important Notes
Log Analytics and Application Insights have been consolidated into Azure Monitor. Operations Management Suite (OMS) brand, as a combination of Application Insights, Azure Automation, Azure Backup, Log Analytics, Site Recovery (for licensing purposes) is retired.
Reference materials
- Azure Monitor overview
- Monitor Azure SQL Database using Azure SQL Analytics (Preview)
- Monitoring Azure SQL Database using dynamic management views
- Announcing the Power BI Solution Template for Azure Activity Log Analytics
- New monitoring capabilities for Power BI Premium Capacities
- Intelligent Insights
- SQL Database Service: Monitoring and performance tuning


