In this blog post, we will look at analysis of stock prices and dividends by industry. This task is important to all participants of Stock Market including individual retail investors, institutional investors such as mutual funds, banks, insurance companies and hedge funds, and publicly traded corporations trading in their own shares.
In this demo, team of Stock Trading Company analyses semi-structured stock data from the New York Stock Exchange (NYSE).
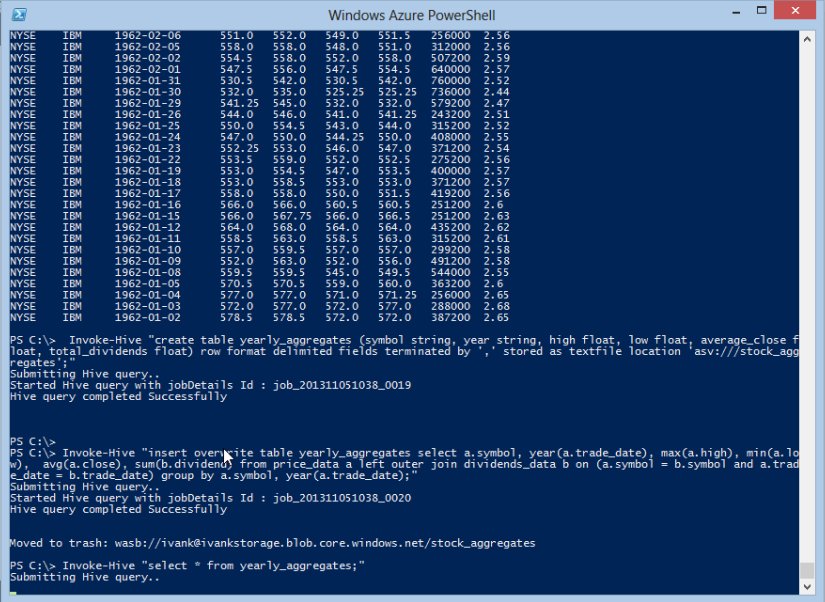
- Data Architect collects data and makes information accessible to business. He will use Hadoop-based distribution on Windows Azure and Hive queries to aggregate stock and dividend data by years.
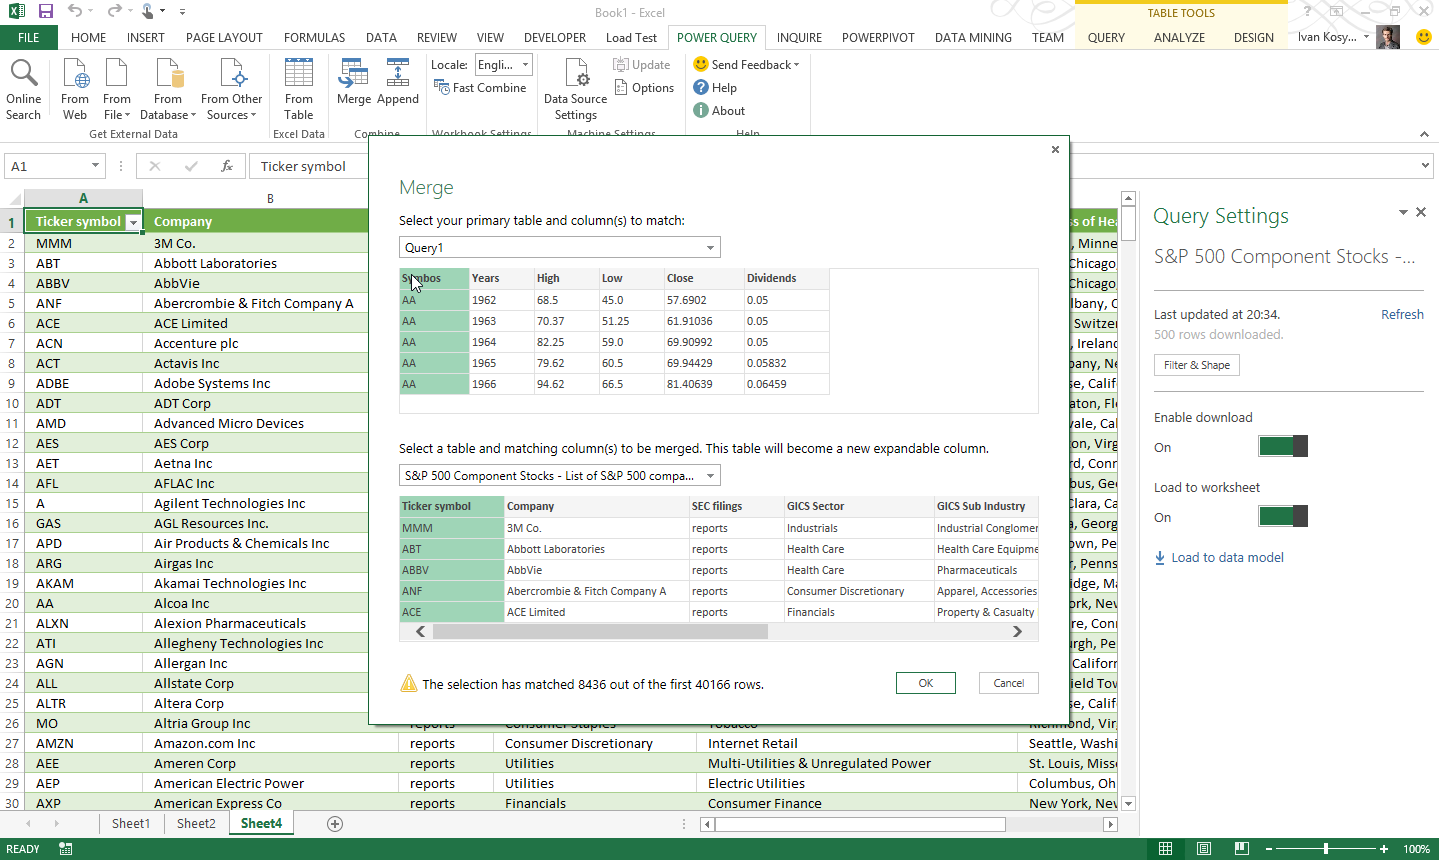
- Financial Analyst will analyze stock data and prepare ad-hoc reports to support trading and management processes. She will use Power Query add-in for Excel to join aggregated data from Hadoop with additional information on top 500 S&P companies from Azure Marketplace Datamarket. Additionally she will create ad-hoc reports with Power View for Excel.
- Trading Executive is responsible for understanding key decision makers and suggesting best product mix of securities. He will make some modifications to Power View reports provided by Financial Analyst.
Details on how Data Architect aggregates data in Hadoop are available in a separate blog post.
Below you can see some screenshots from the demo.